ChatGPT vs PlotStudio AI for Data Analysis: A Real Side-by-Side Test

- One tool gave a formula. The other produced an analyst-grade report. ChatGPT ran a regression in 30 seconds — no cleaning, no exploration, no caveats. PlotStudio planned for 38 seconds, then cleaned the data, explored correlations, flagged multicollinearity, built a model with interaction terms, interpreted it in plain English, and documented limitations.
- Before a single question was asked, PlotStudio already:— classified missingness (MNAR, MAR, MCAR per column) with imputation strategies— identified high-signal features and suggested derived ones— flagged analytical risks like multicollinearity and extrapolation— rendered a profiling viewer with distributions and quality scoresChatGPT showed a summary and asked, “What do you want to do?”
- PlotStudio’s model actually performed better: R² 0.769 vs 0.762, RMSE $38,224 vs $42,682 — a $4,458 improvement per prediction driven by interaction terms that captured how living area is worth more in higher-quality homes.
- Same underlying AI, different system. PlotStudio wraps the same language model in a multi-agent pipeline that enforces the analytical workflow chatbots skip: profile, clean, explore, model, interpret, caveat. Speed is the wrong metric when someone is making a decision based on your output.
Same dataset. Same question. Same moment.
I uploaded the Ames Housing dataset — 1,460 homes, 81 features — to both ChatGPT and PlotStudio AI and asked the same question:
“Predict the sale price of a house based on its overall quality, living area size, and garage characteristics”
ChatGPT answered in 30 seconds. PlotStudio answered in 3 minutes and 46 seconds.
If you stopped there, ChatGPT wins. It’s faster. But speed isn’t the metric that matters when someone is making decisions based on your analysis. What matters is: would you hand this output to a client?
Here’s both tools processing the same question side by side. We’ll break down every difference below.
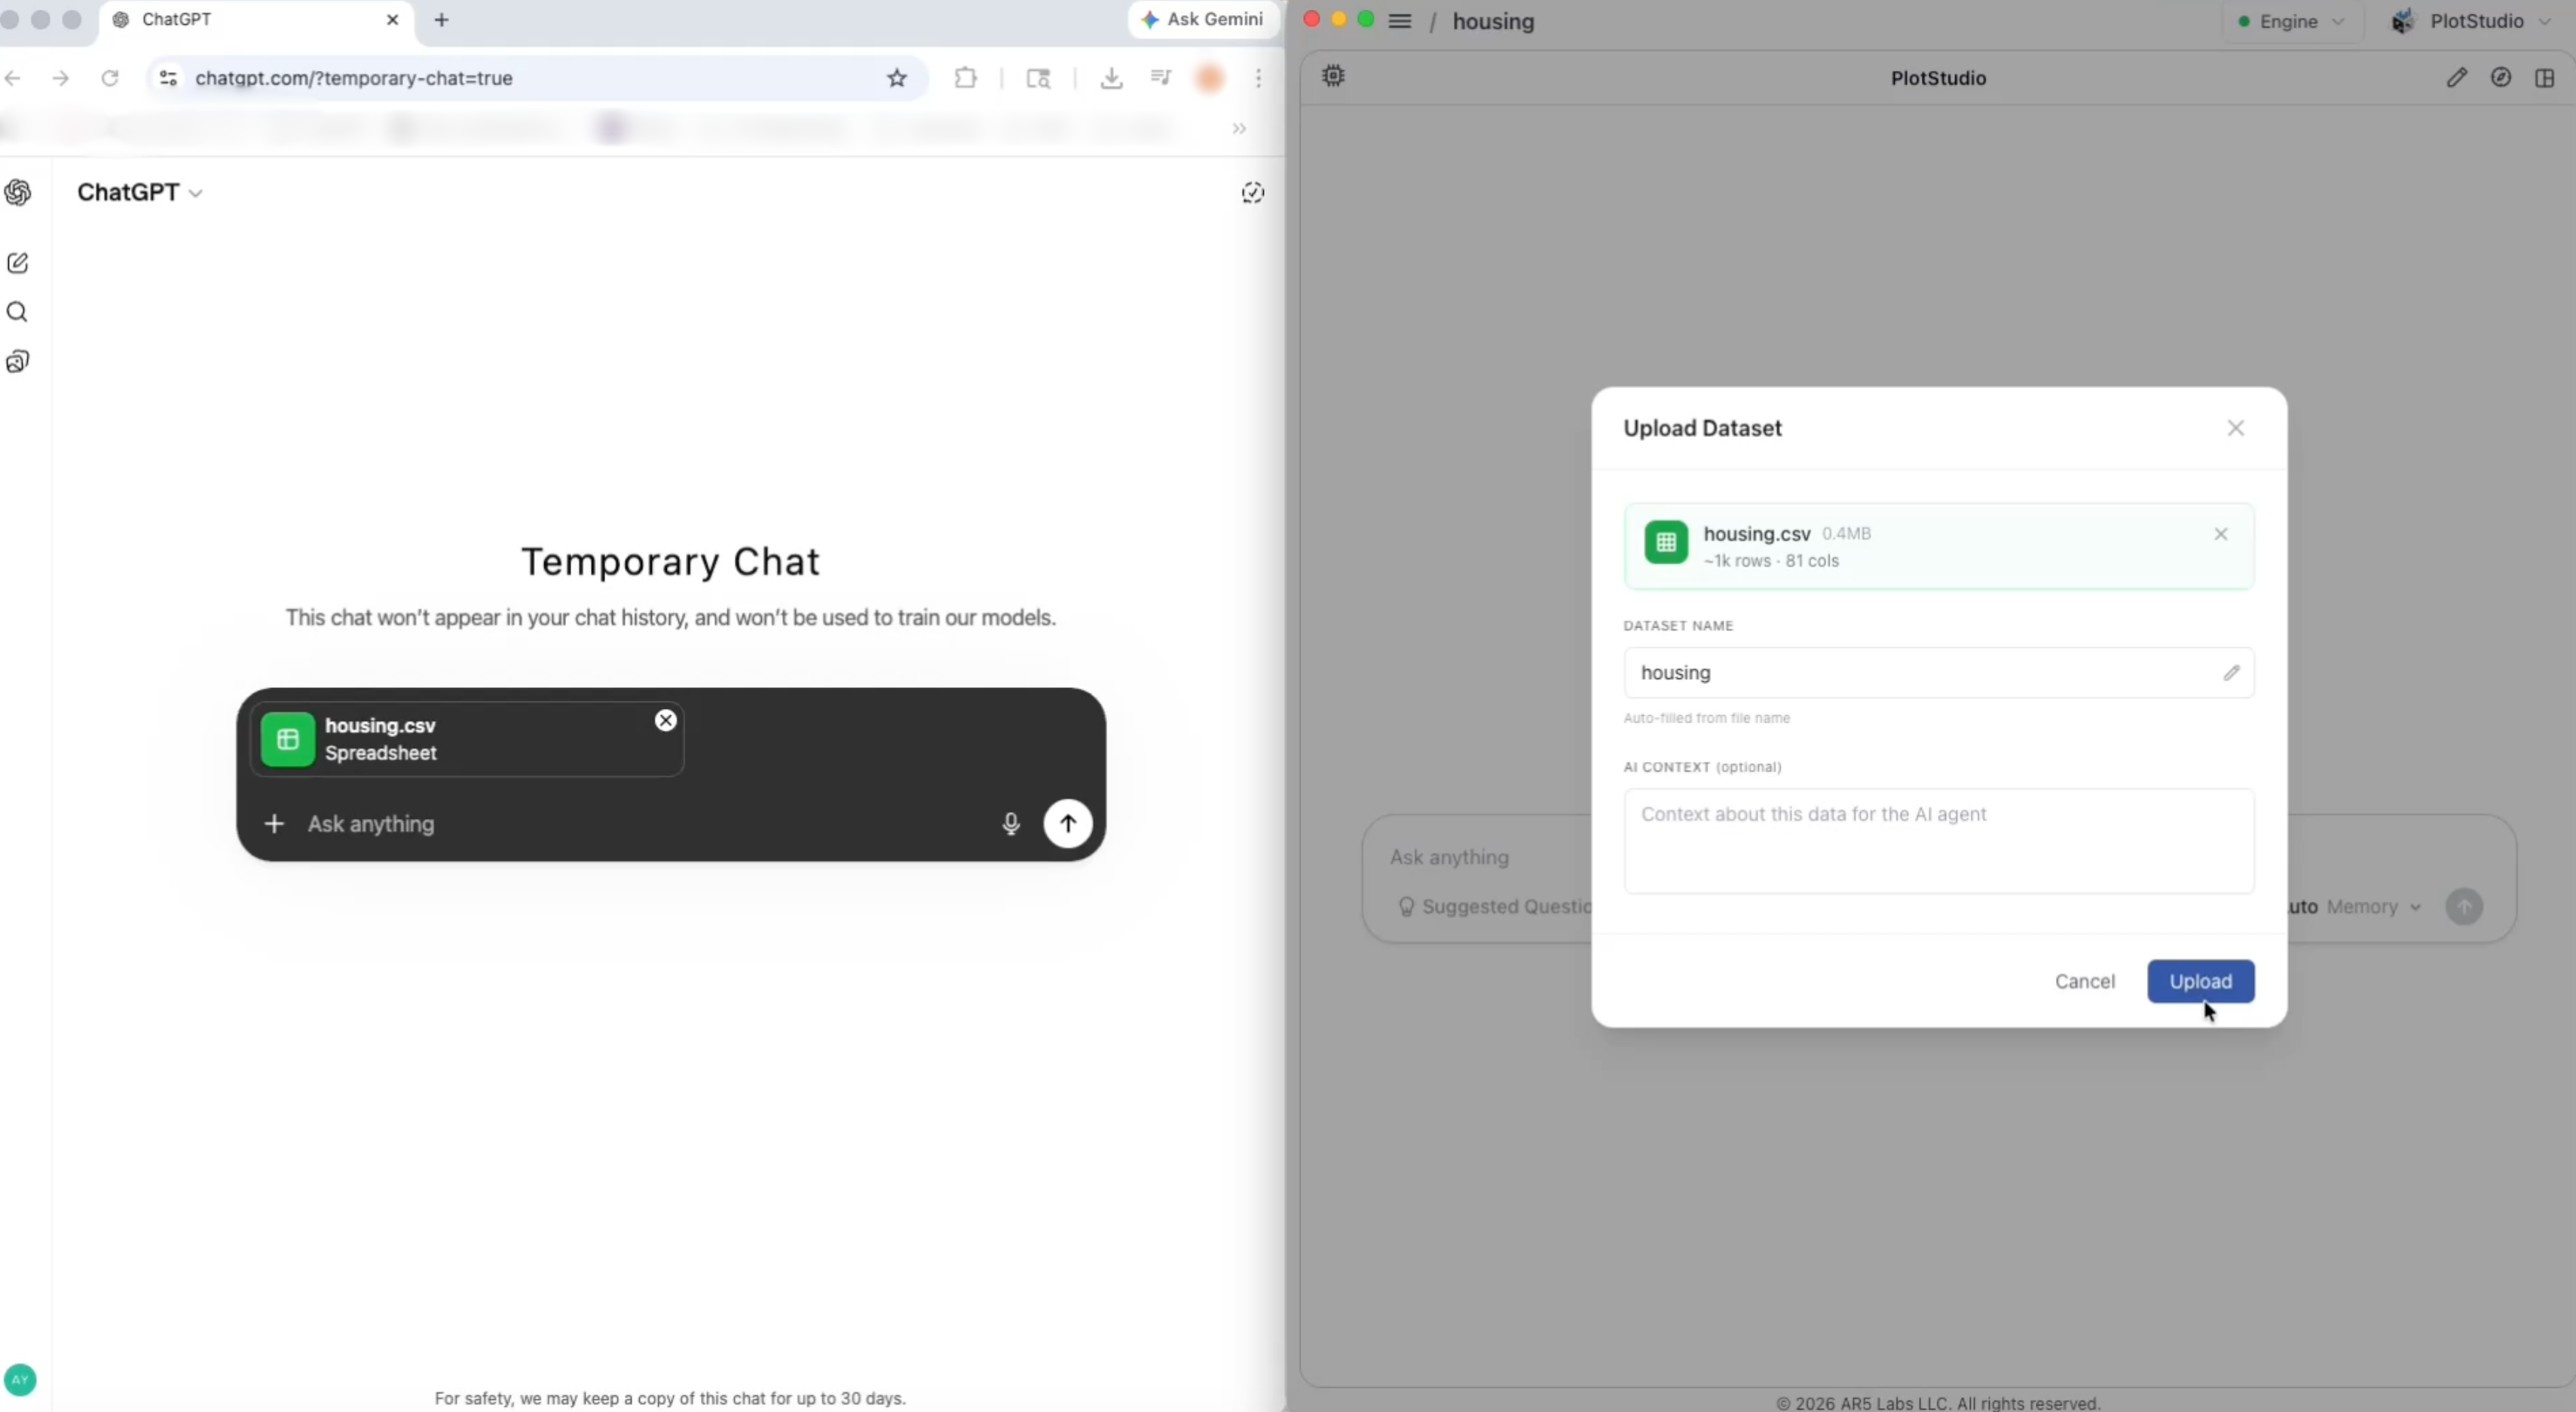
The Upload
Before we even get to the question, the experience diverges.
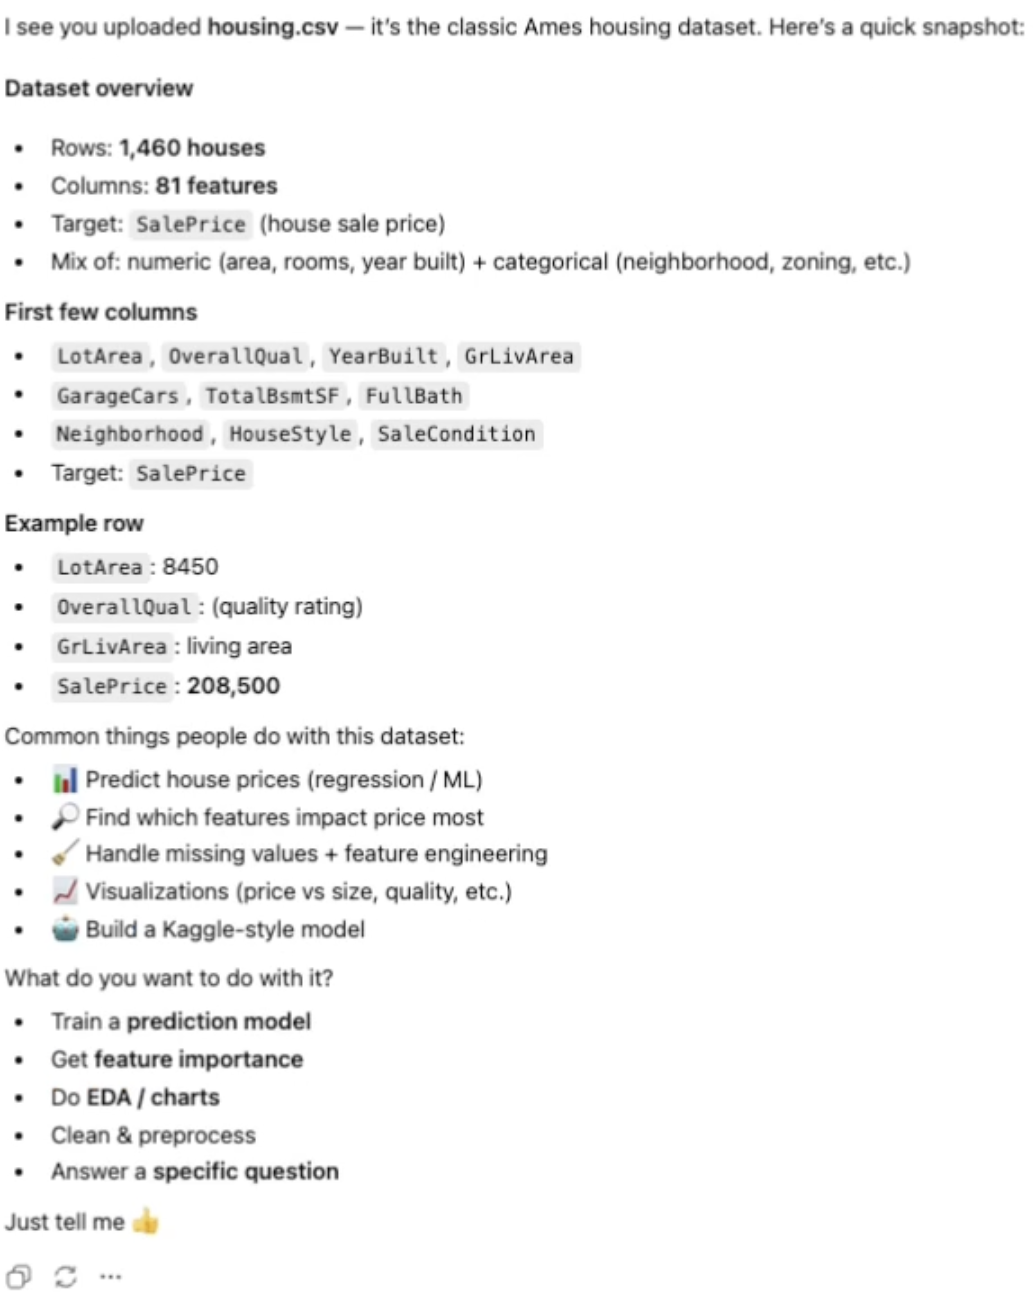
ChatGPT: A Summary and a Menu
ChatGPT gives you a quick overview — 1,460 rows, 81 features, a few example columns — and then asks you what you want to do. It lists options like a restaurant menu:
- Train a prediction model
- Get feature importance
- Do EDA / charts
- Clean & preprocess
- Answer a specific question
It’s a reasonable starting point. But notice what’s missing: ChatGPT didn’t look at the data. It counted rows and columns, listed some column names, and waited for instructions. No missing value analysis. No quality assessment. No identification of which columns need cleaning. No warning about the 99.5% missingness in PoolQC or the 17.7% missingness in LotFrontage. It gave you a menu without reading the ingredients list.
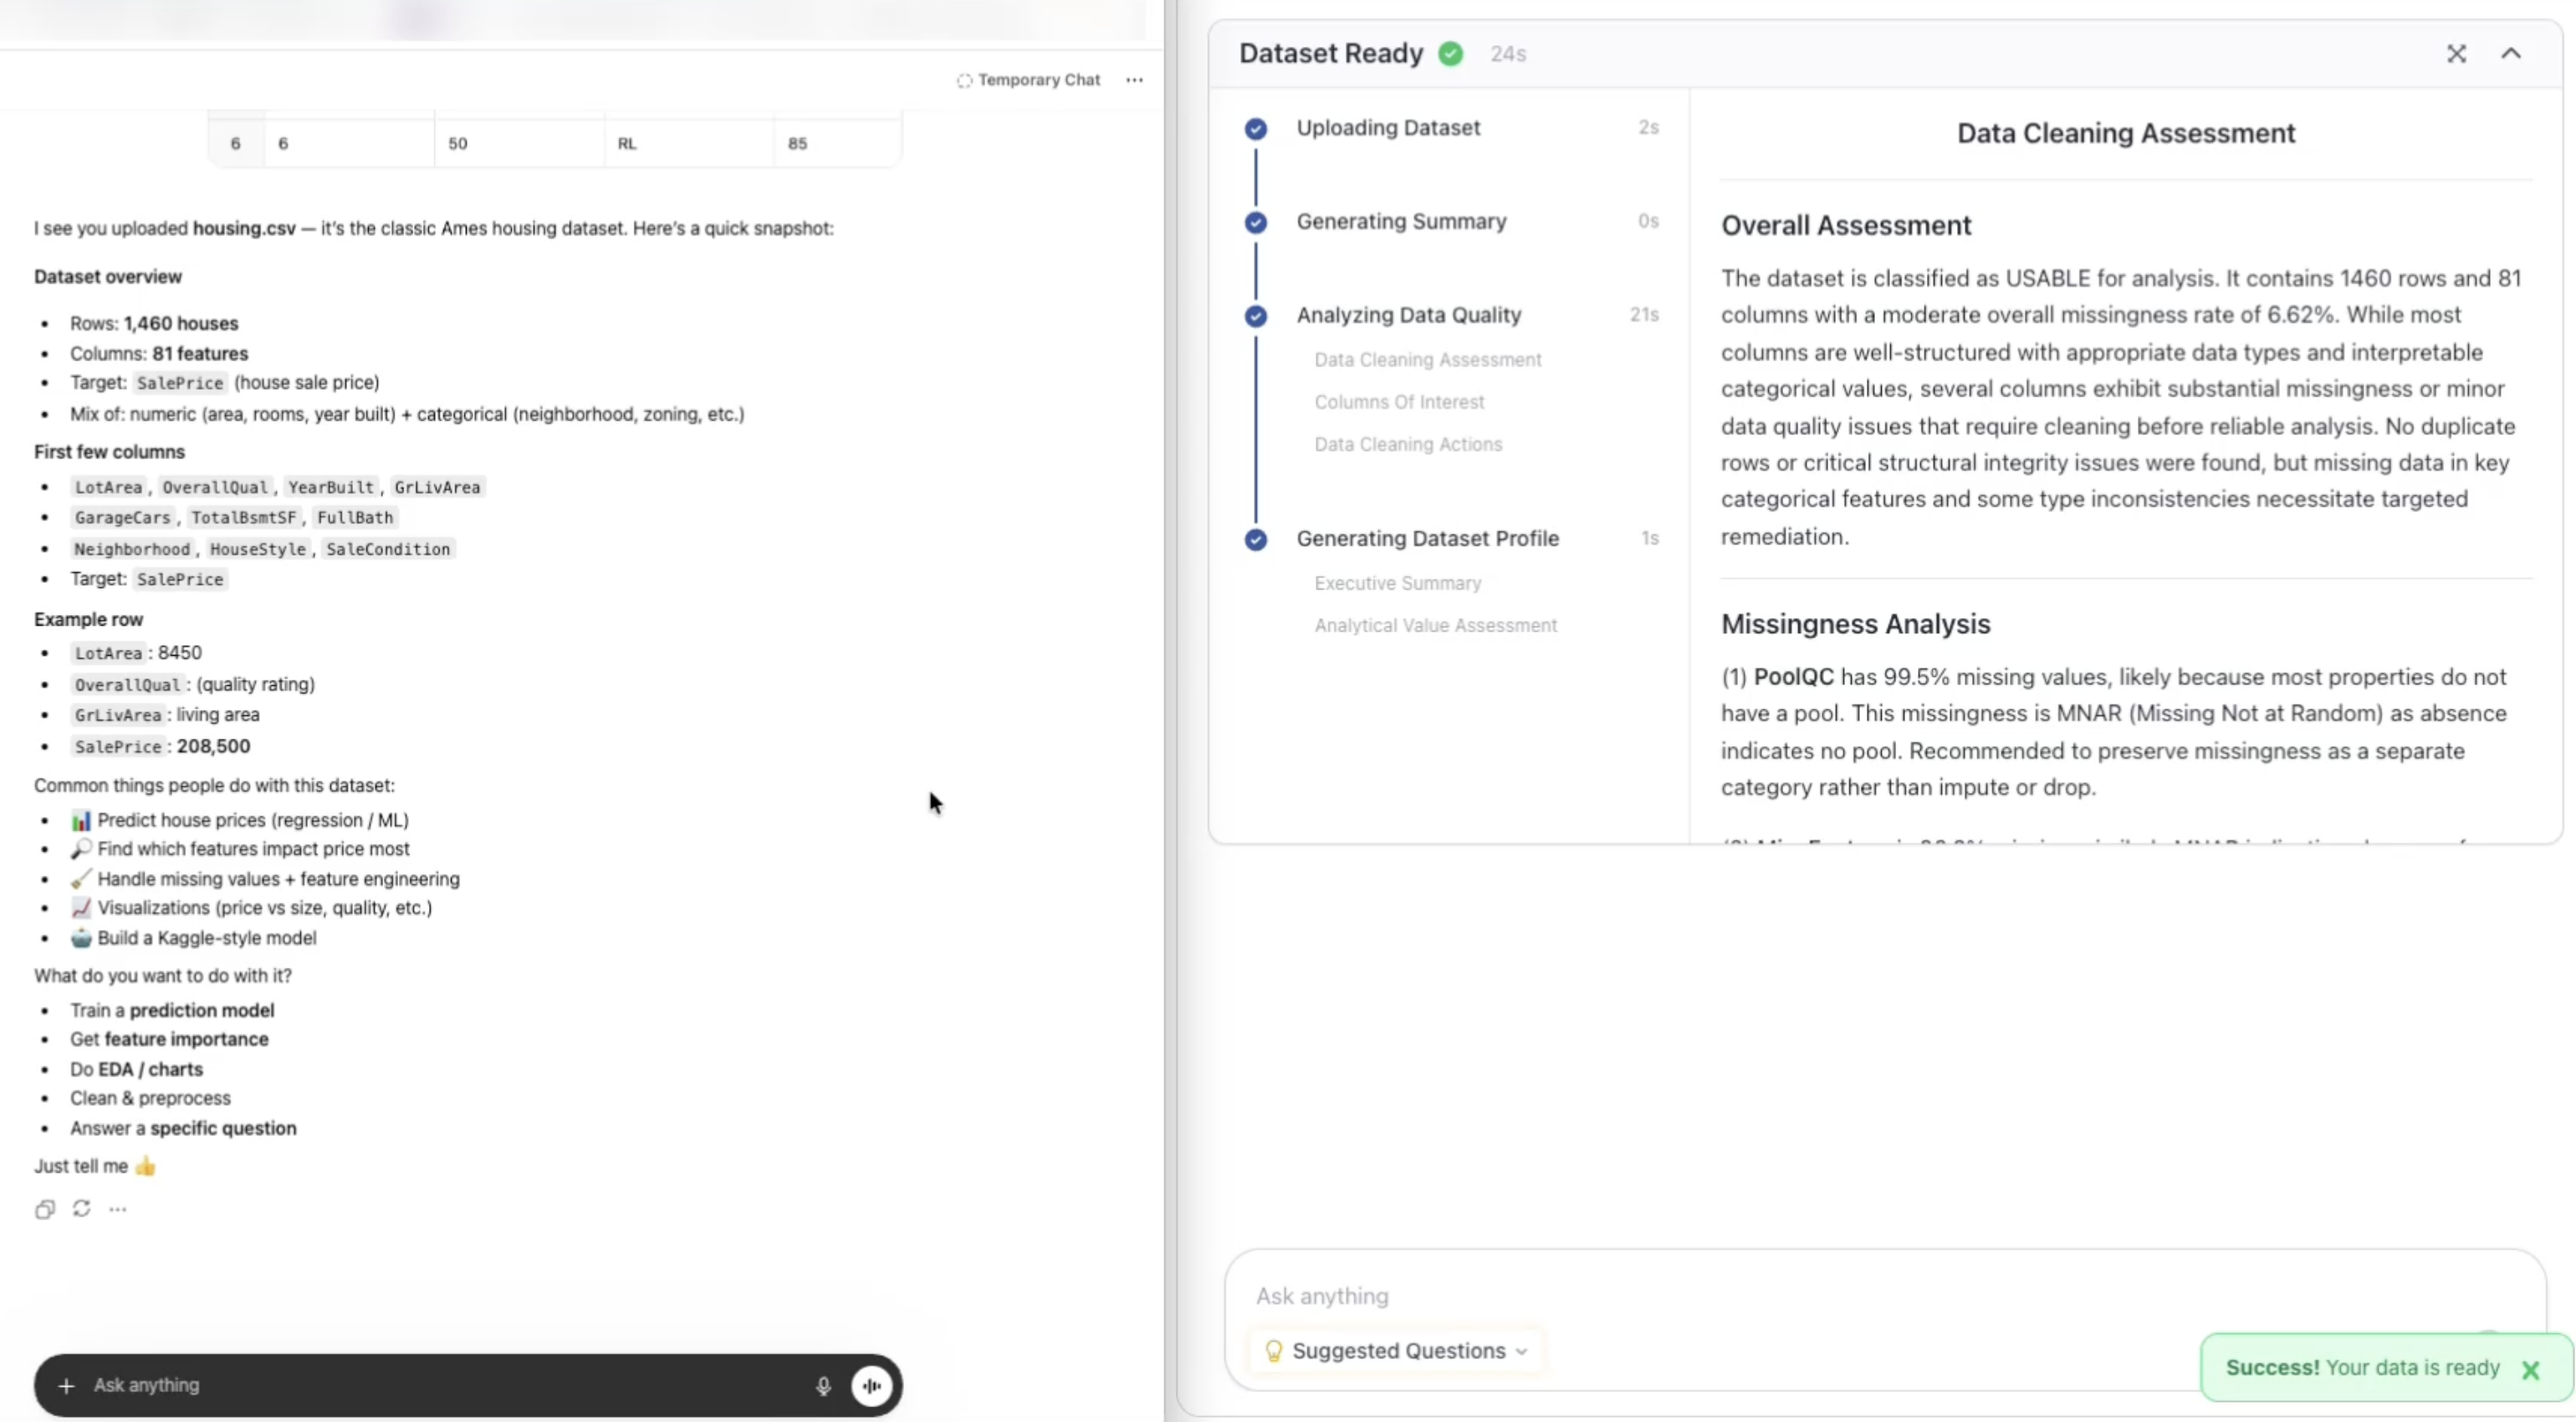
PlotStudio AI: A Full Data Cleaning Assessment in 24 Seconds
PlotStudio AI didn’t ask what you want to do. It started working. In 24 seconds, it produced a comprehensive data cleaning assessment that covers everything an analyst would check before touching a model:
Overall assessment: Dataset classified as USABLE — 1,460 rows, 81 columns, 6.62% overall missingness rate. No duplicate rows, no structural integrity issues, but targeted cleaning required.
Missingness analysis with reasoning: PlotStudio AI didn’t just count missing values — it classified why they’re missing:
| Column | Missing | Type | Action |
|---|---|---|---|
| PoolQC | 99.5% | MNAR | Recode as "NoPool" |
| MiscFeature | 96.3% | MNAR | Recode as "None" |
| Alley | 93.8% | MNAR | Recode as "NoAlley" |
| Fence | 80.8% | MNAR | Recode as "NoFence" |
| MasVnrType | 59.7% | MNAR | Recode as "None" |
| FireplaceQu | 47.3% | MNAR | Recode as "NoFireplace" |
| LotFrontage | 17.7% | MAR | Impute median + indicator |
| Garage fields (5) | 5.5% | MNAR | Recode as "NoGarage" |
| Basement fields (5) | 2.5% | MNAR | Recode as "NoBasement" |
| Electrical | 0.1% | MCAR | Drop 1 row |
If you’re not familiar with these acronyms, here’s why they matter:
- MNAR (Missing Not at Random) — the data is missing because of what the value would be. A house with no pool has no pool quality rating. The “missing” value is the information — it tells you the feature doesn’t exist. You don’t fill these in with averages. You recode them as explicit categories like “NoPool” or “NoGarage.”
- MAR (Missing at Random) — the data is missing for reasons related to other columns, not the missing value itself. LotFrontage might be missing because certain neighborhoods didn’t record it — not because the frontage is unusually small or large. You can safely impute these with a median or model-based estimate.
- MCAR (Missing Completely at Random) — the data is missing by pure chance, with no pattern. One house out of 1,460 is missing its Electrical value — no reason, just a gap. You can drop the row without introducing bias.
This distinction determines how you handle each missing column. Get it wrong and you introduce bias into every model you build downstream. PlotStudio AI classified every missing column by its missingness mechanism and recommended the appropriate action for each. ChatGPT didn’t mention missing values at all.
But the profiling didn’t stop at cleaning. PlotStudio AI also produced:
- An executive summary — what the dataset represents, its source, temporal coverage (2006–2010), and structural groupings across 6 thematic clusters
- High-signal columns — OverallQual, GrLivArea, GarageCars, Neighborhood, TotalBsmtSF identified as the strongest analytical levers
- Derived features worth creating — AgeAtSale, YearsSinceRemodel, TotalPorchSF, TotalBath, TotalSF — with explanations of why each adds analytical value
- 5 story angles — ready-made hypotheses like “Properties with recent remodeling command a premium independent of overall quality”
- Analytical risks — multicollinearity warnings, outlier influence, temporal confounding, and dominant category flags
- A completion guarantee — confirming that executing the recommended actions will elevate the dataset from USABLE to CLEAN status
All of this in 24 seconds. Before a single question was asked.
ChatGPT asked “What do you want to do?” PlotStudio AI already did it. In 24 seconds it classified every missing value by its missingness mechanism, identified high-signal columns, suggested derived features, and flagged analytical risks.
The Data Viewer: Spreadsheet vs. Intelligence Layer
The difference doesn’t stop at the summary. Look at how each tool lets you see your data.
ChatGPT gives you a raw spreadsheet — rows and columns, no context. You’re scrolling through 1,460 rows and 81 columns on your own, trying to spot patterns by eye:
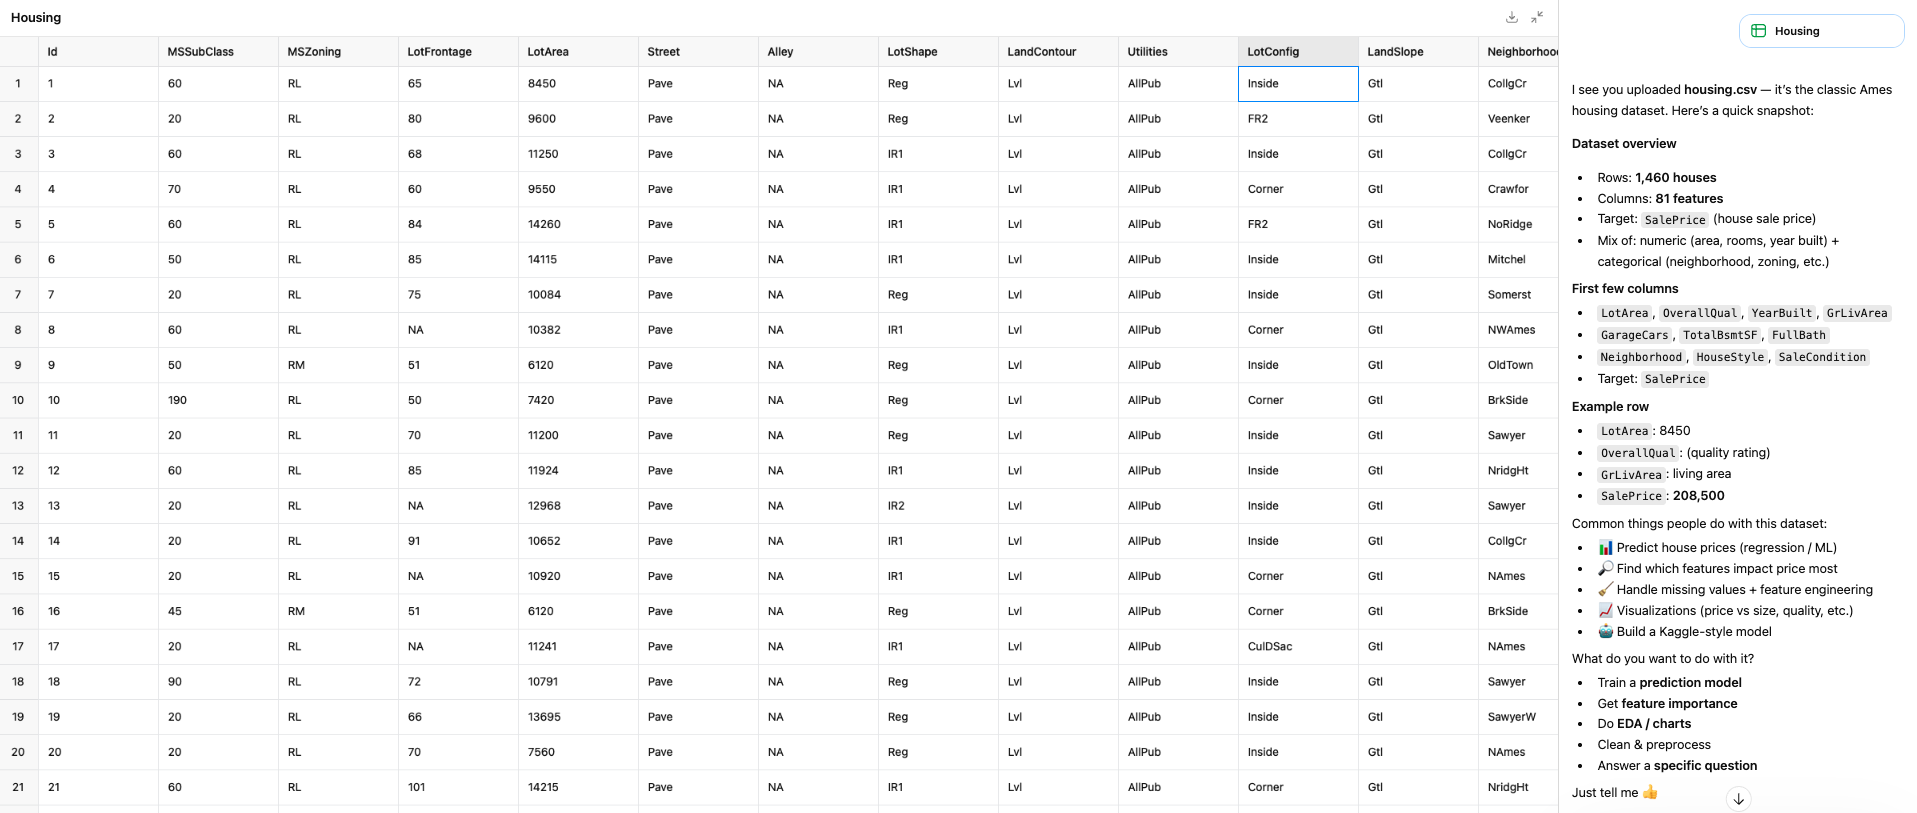
PlotStudio AI gives you an intelligence layer on top of the data — profiling tabs with distribution cards, quality scores, column-level statistics, and the full data table. You’re not just looking at the data, you’re understanding it:
Now, the Question
“Predict the sale price of a house based on its overall quality, living area size, and garage characteristics”
Same question, asked to both tools at the same time. Here’s what each one came back with.
ChatGPT: The 30-Second Answer
ChatGPT produced a single page. Here’s the entire output:
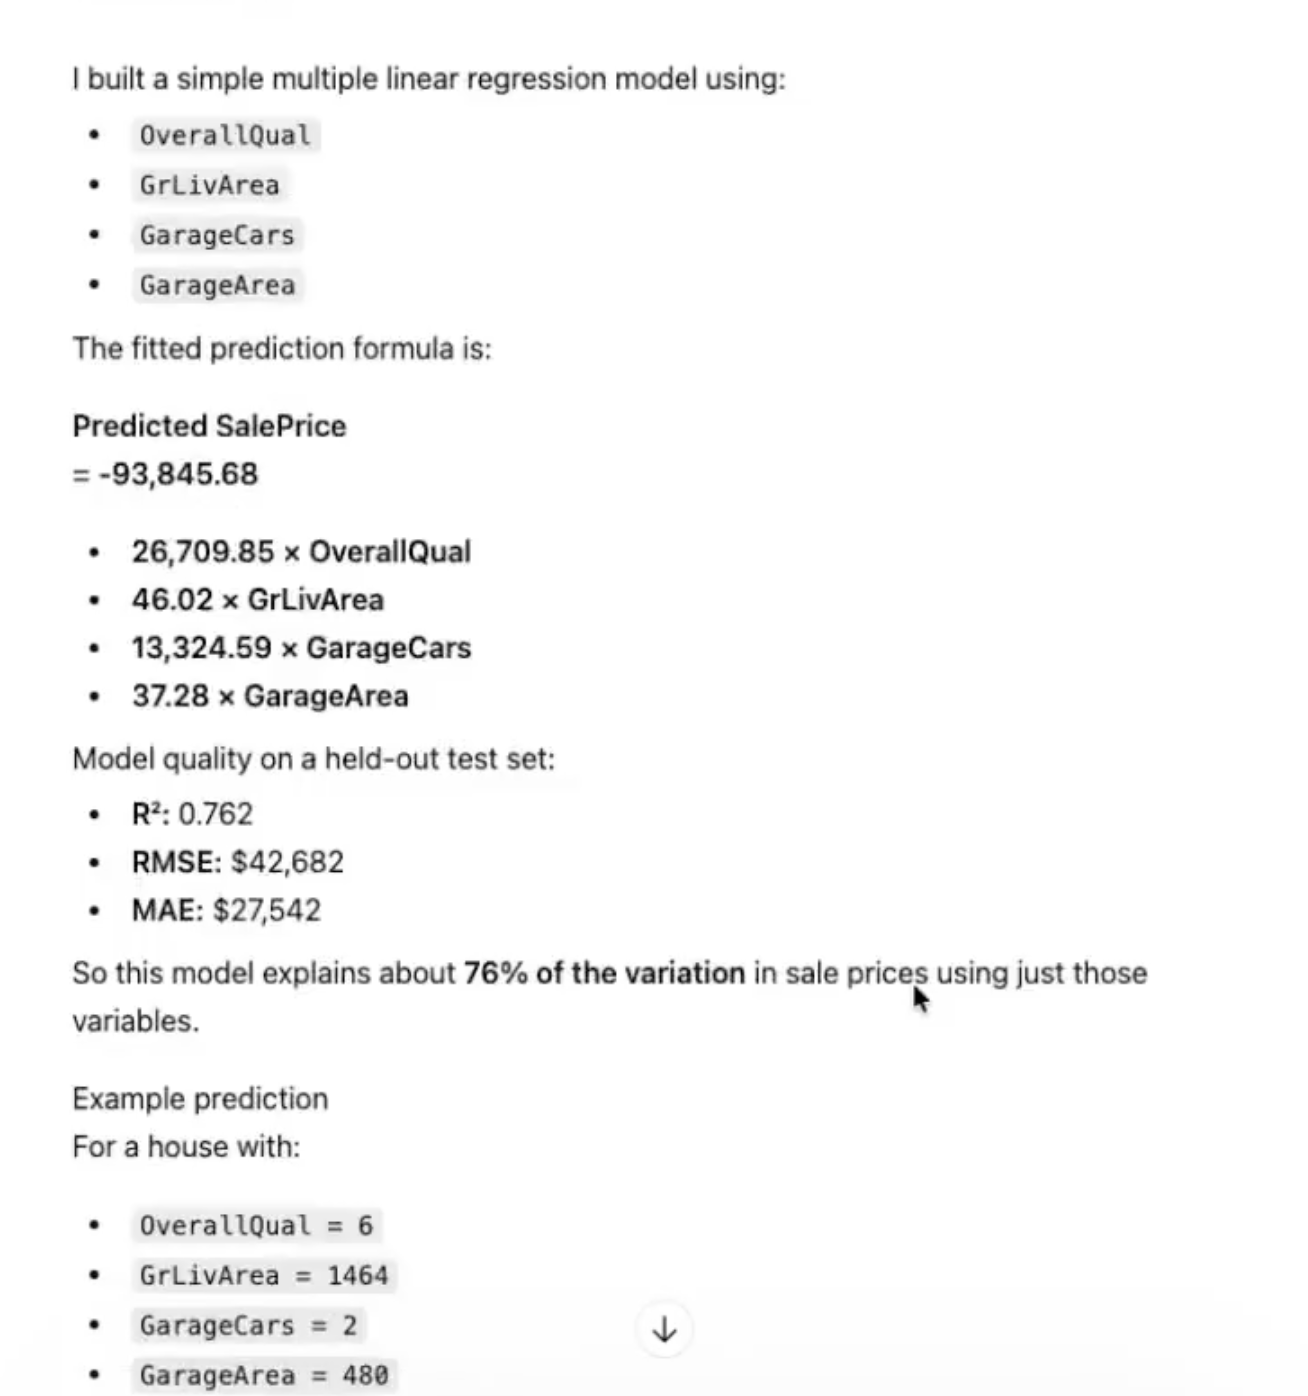
A linear regression formula:
Model metrics: R² = 0.762, RMSE = $42,682, MAE = $27,542.
One example prediction for a house with OverallQual = 6, GrLivArea = 1464, GarageCars = 2, GarageArea = 480 → predicted price ~$178,325.
And then: “Send me the house’s OverallQual, GrLivArea, GarageCars, and GarageArea, and I’ll calculate the price.”
That’s it. The entire analysis.
No data cleaning. No missing value handling. No exploration of how these features relate to each other. No check for multicollinearity. No interaction terms. No feature distributions. No visualizations. No discussion of limitations. No caveats about extrapolation. No mention of the 82 features it ignored.
It ran a regression and gave you a formula. That’s what a calculator does, not an analyst.
PlotStudio: The 3-Minute-46-Second Answer
PlotStudio AI produced a multi-page, publication-ready PDF report. Here it is — scroll through it, then we’ll break down what the AI agents actually did step by step.
Phase 1: Planning (38 seconds)
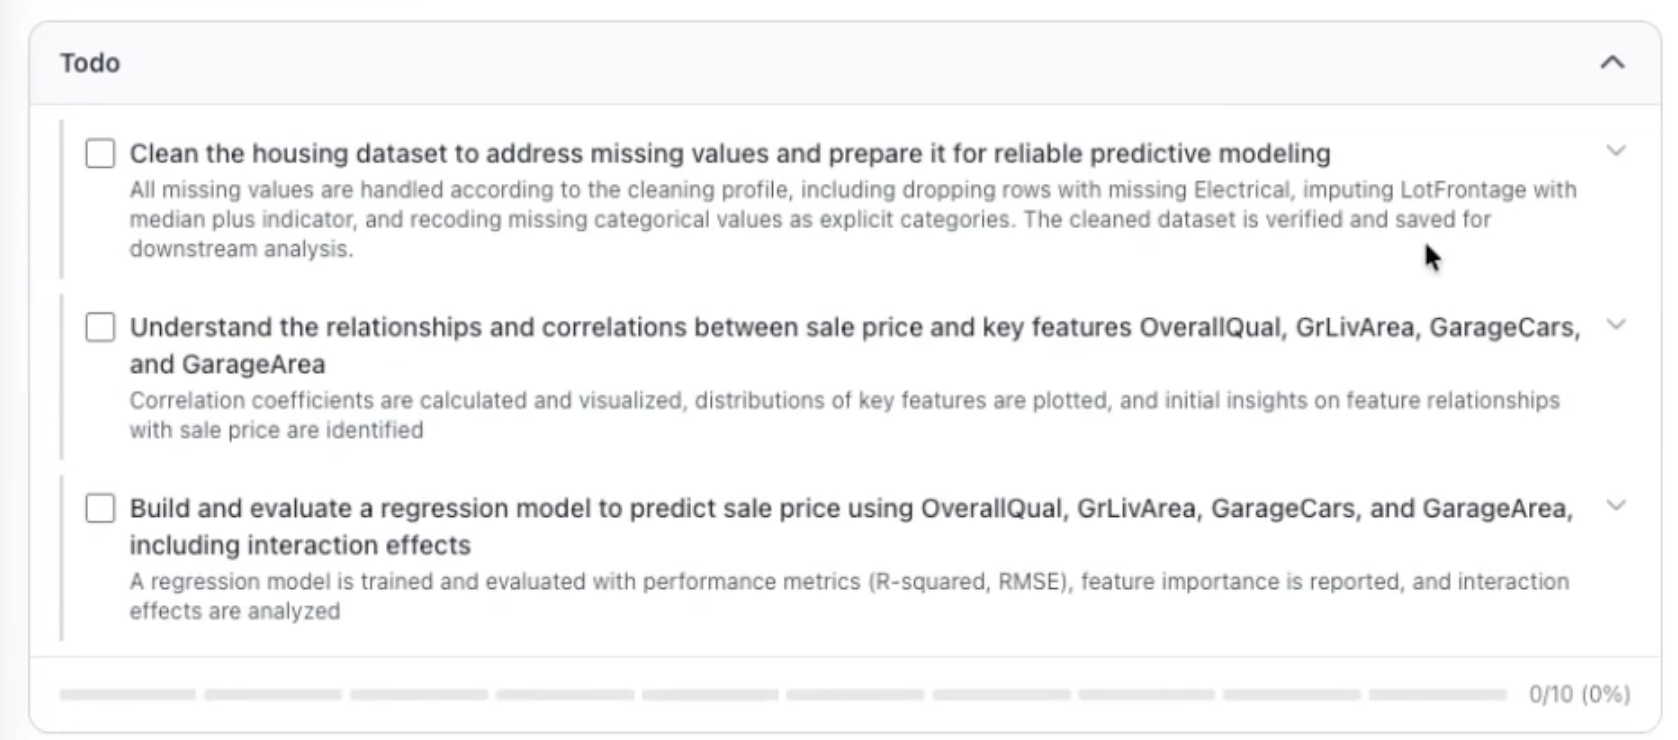
The moment you ask the question, PlotStudio doesn’t start coding. It plans. A dedicated planning agent creates a structured TODO — a multi-step analysis roadmap — before a single line of code runs. This is the same thing a good analyst does: think before you execute.
The plan for this question included: clean the data, profile the key features, analyze correlations, build a model with interaction terms, evaluate performance, and narrate the findings.
38 seconds of planning. ChatGPT spent 0.
The 38-second planning phase is the difference between a chatbot that runs code and an analytics platform that thinks about the problem first.
Phase 2: Data Cleaning
PlotStudio’s agents didn’t just run a regression on raw data. They cleaned it first:
- Removed rows with missing Electrical values (1 row dropped)
- Imputed LotFrontage with the median (69.0 feet) for 259 missing values — and created a binary indicator column (
LotFrontage_was_missing) to preserve the missingness signal - Recoded amenity-related missing values as explicit categories:
NoPool,NoAlley,NoFence,NoFireplace— because in housing data, “missing” usually means “absent,” not “unknown” - Standardized garage and basement fields —
NoGarageandNoBasementlabels instead of nulls
The result: 1,459 rows, 82 columns, zero missing values in any key predictor or target.
ChatGPT did none of this. It took the raw data and ran a regression. If there were missing values in the features it used, it either dropped them silently or let scikit-learn handle them with defaults — and it didn’t tell you which.
Phase 3: Exploration and Correlation Analysis
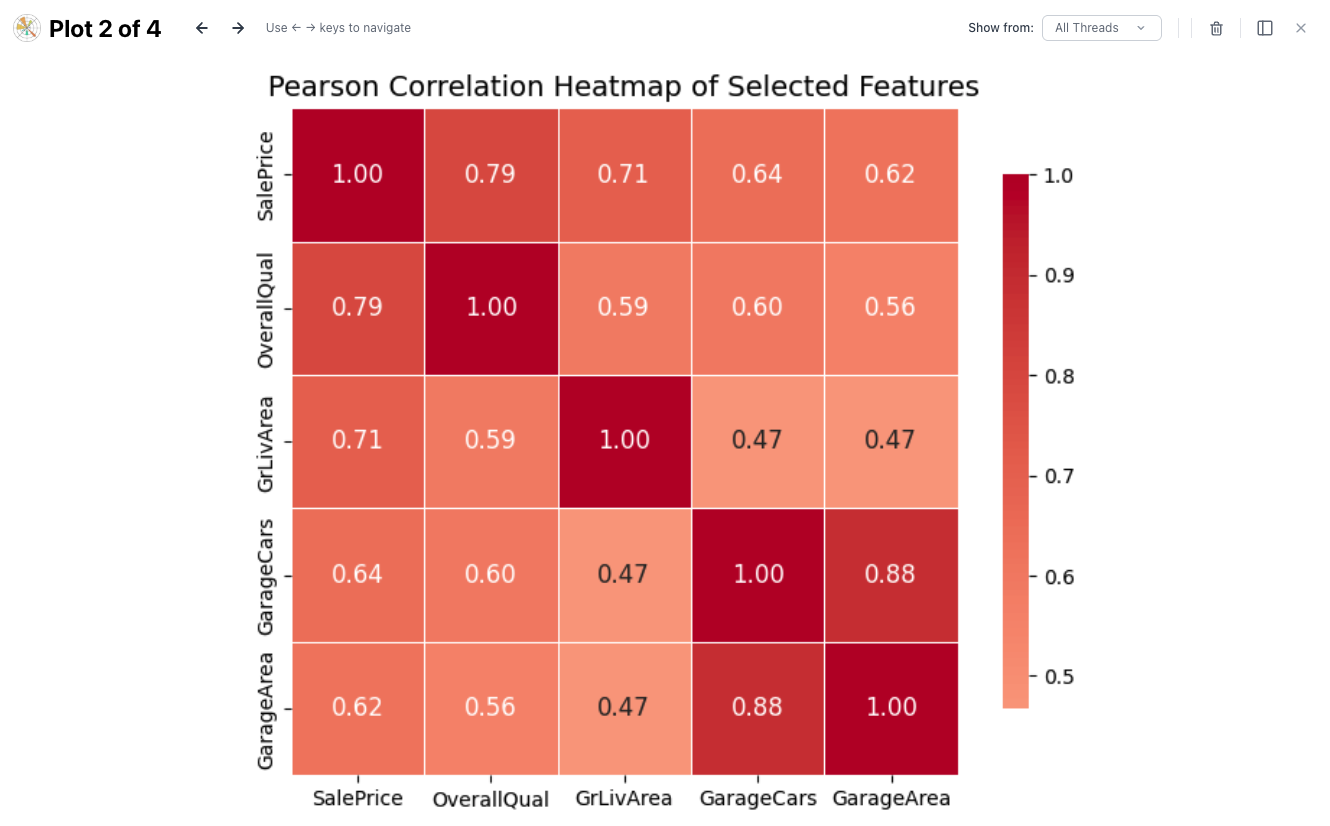
Before building the model, PlotStudio explored how the features relate to each other and to sale price:
| Pair | Correlation | Interpretation |
|---|---|---|
| SalePrice – OverallQual | ~0.79 | Very strong — quality dominates pricing |
| SalePrice – GrLivArea | ~0.71 | Strong — larger homes sell for more |
| SalePrice – GarageCars | ~0.64 | Strong — more car capacity, higher price |
| SalePrice – GarageArea | ~0.62 | Strong — but slightly less than car count |
| GarageCars – GarageArea | ~0.88 | Multicollinearity — these measure the same thing |
That last row matters. GarageCars and GarageArea are correlated at 0.88 — they’re measuring almost the same thing. Including both in a linear model without accounting for this creates multicollinearity: unstable coefficients that can flip signs or inflate standard errors.
ChatGPT included both features and never mentioned the issue. PlotStudio AI flagged it explicitly and explained why it matters.
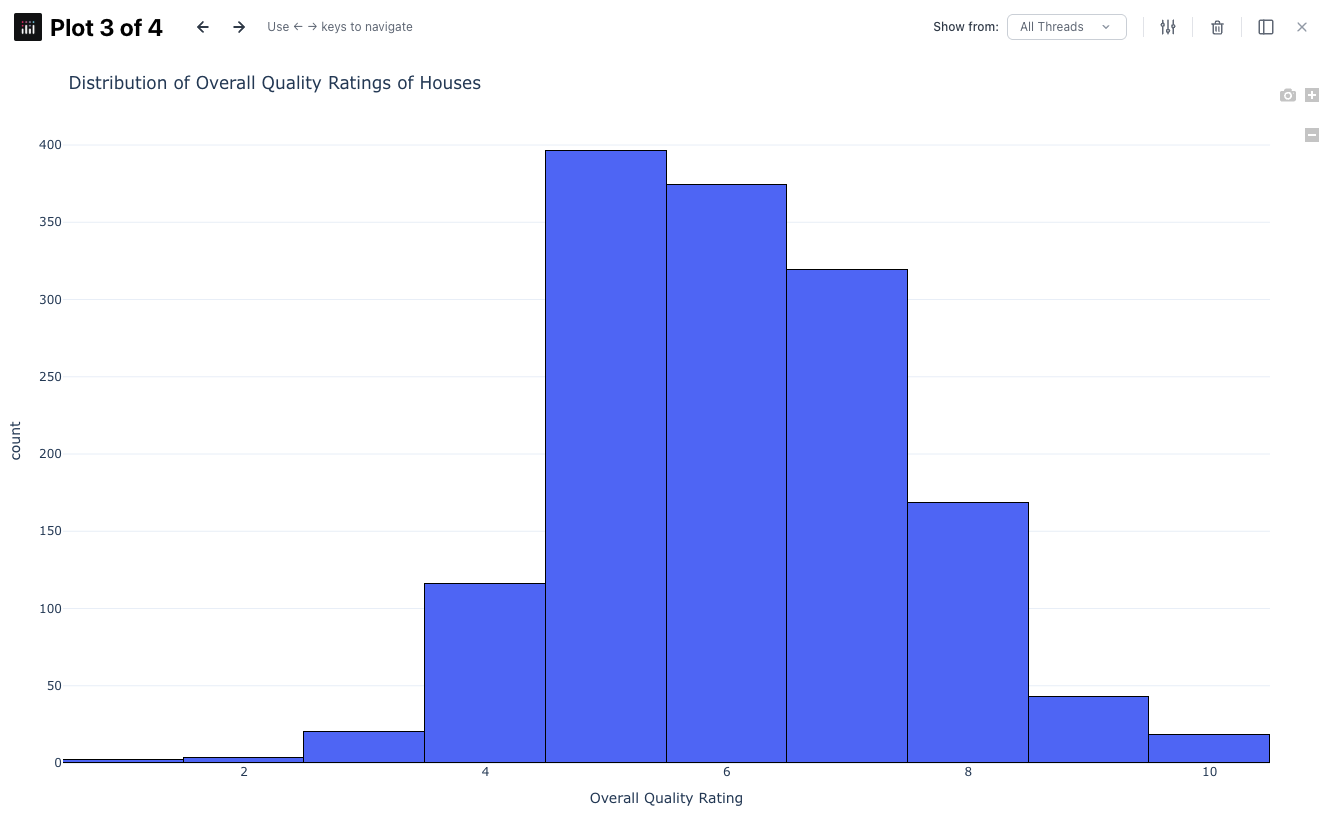
The agents also analyzed the distribution of OverallQual — noting that most homes cluster between quality 5–7, with very few at the extremes. This means predictions for very low or very high quality homes are extrapolations and should be treated with caution. ChatGPT didn’t mention this either.
Phase 4: Model Building — With Interaction Terms
Here’s where the analytical depth gap becomes undeniable.
ChatGPT built a basic linear regression with four features. PlotStudio AI built a model with six features — the original four plus two interaction terms:
- OverallQual × GrLivArea — Does living area become more valuable in higher-quality homes?
- GarageCars × GarageArea — Is garage space worth more when it holds more cars?
The answer to both: yes.
The interaction terms reveal something ChatGPT’s model completely missed: “just more space” isn’t universally valuable. An extra 200 sq ft in a high-quality home increases price more than the same 200 sq ft in a low-quality home. A 600 sq ft two-car garage adds more value than a 600 sq ft one-car garage. These are real buyer behaviors that a simple additive model can’t capture.
ChatGPT
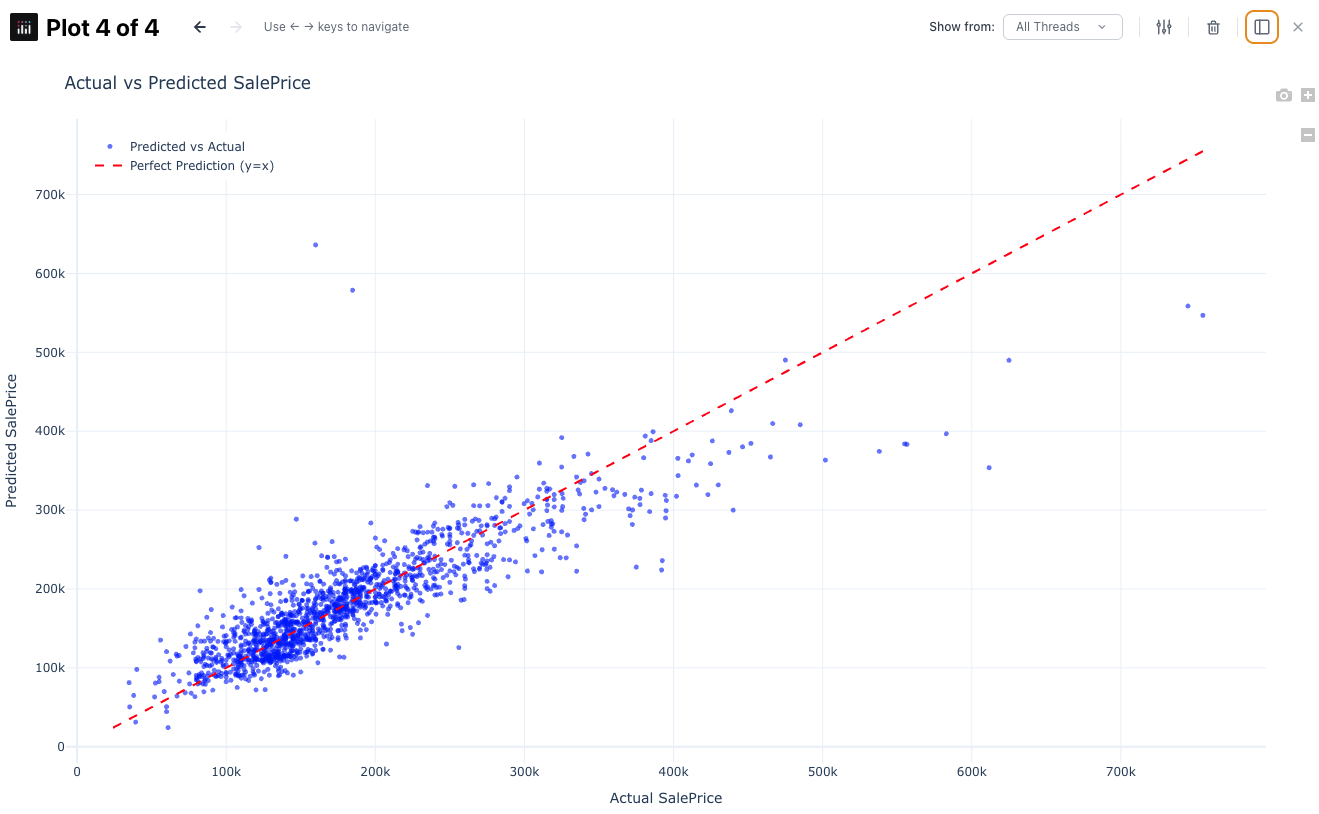
PlotStudio
The R² difference looks small. The RMSE difference is $4,458 per prediction. On a dataset of 1,459 homes, that’s a meaningful improvement — and it comes from the AI agents thinking about the problem more carefully, not just running the default.
Phase 5: Interpretation
ChatGPT gave you coefficients. PlotStudio AI told you what they mean:
“Overall quality dominates. Each one-step increase in quality increases predicted price by about $10.8k. Combined with the interaction term, higher-quality homes especially benefit from additional square footage.”
“Raw GrLivArea and GarageArea main effects are negative, but their interactions are positive. This means the model is capturing that ‘just more space’ is not universally valuable — space is worth more when paired with quality or capacity.”
This is the difference between data and insight. ChatGPT told you the numbers. PlotStudio AI told you the story.
ChatGPT gave you a formula. PlotStudio AI told you that living area is worth more in higher-quality homes. One is a calculation. The other is an insight.
Phase 6: Limitations
PlotStudio’s report ends with a limitations section — something ChatGPT never provided:
- In-sample only: Metrics may be slightly optimistic vs. true out-of-sample performance
- Limited features: Only 4 of 82 features used; neighborhood, age, basement finish, and lot characteristics could improve accuracy
- Linearity assumption: Real housing markets have non-linear relationships not fully captured
- Extrapolation risk: Data concentrated in mid-range; extreme predictions are less reliable
- Multicollinearity: GarageCars and GarageArea are highly correlated; individual coefficients can be unstable
An analyst who doesn’t discuss limitations isn’t being thorough — they’re being reckless. PlotStudio AI builds this into every report by default.
Side-by-Side: What You Actually Get
| ChatGPT | PlotStudio AI | |
|---|---|---|
| Time | 30 seconds | 3 minutes 46 seconds |
| Planning | None | 38-second structured TODO |
| Data cleaning | None documented | Full pipeline: imputation, recoding, indicators |
| Missing values | Silent / unknown | Explicit strategy per column, documented |
| Exploration | None | Correlation heatmap, distributions, multicollinearity flag |
| Model | 4 features, no interactions | 6 features with interaction terms |
| R² | 0.762 | 0.769 |
| RMSE | $42,682 | $38,224 |
| Interpretation | Coefficients listed | Business-language explanation |
| Interaction insights | None | "Space is worth more in higher-quality homes" |
| Limitations | None | 5 specific caveats with explanations |
| Output format | Chat message | Publication-ready PDF with figures |
| Client deliverable? | No | Yes |
Why 30 Seconds Isn’t a Win
Speed is the wrong metric for analysis.
If you need a quick formula to plug into a spreadsheet, ChatGPT is fine. But if someone is going to make a decision based on your output — pricing a home, allocating a budget, advising a client — 30 seconds of work produces 30 seconds of rigor.
ChatGPT optimizes for response speed. It gives you an answer as fast as possible. PlotStudio AI optimizes for analytical rigor. It gives you an answer you can defend.
The 38 seconds PlotStudio AI spent planning is the difference. A human analyst doesn’t open a dataset and immediately start fitting models. They look at the data first. They check for problems. They think about what features might interact. They consider what could go wrong. That’s what the planning phase does — and it’s what ChatGPT skips entirely.
3 minutes and 46 seconds for a client-ready report with data cleaning, exploration, interaction terms, interpretation, and limitations. That’s not slow. That’s thorough.
ChatGPT optimizes for response speed. PlotStudio AI optimizes for analytical rigor. When someone is making a decision based on your output, speed is the wrong metric.
Why ChatGPT Isn’t Built for Data Analysis
ChatGPT is a brilliant generalist. It can write poetry, debug code, explain quantum physics, and run a regression — all in the same conversation. But that’s exactly the problem.
ChatGPT doesn’t know that analysis has phases: cleaning, exploration, modeling, interpretation, caveating. It treats every question as a single-turn prompt, not a multi-step investigation. It optimizes for giving you an answer as fast as possible — not for giving you a defensible answer.
Here’s the irony: PlotStudio uses the same underlying language model as ChatGPT. The difference isn’t the AI — it’s the system around it. PlotStudio AI wraps that same model in a multi-agent architecture with specialized agents for planning, execution, error recovery, and narration. It enforces the discipline that ChatGPT skips: profile before you model, clean before you fit, interpret after you evaluate, caveat before you deliver.
ChatGPT has the raw intelligence. What it lacks is the analytical workflow. And in data analysis, the workflow is the product.
PlotStudio and ChatGPT use the same underlying AI. The difference is PlotStudio AI wraps it in a multi-agent system that enforces the analytical discipline ChatGPT skips entirely.
What PlotStudio Adds on Top
PlotStudio AI is purpose-built for one thing: turning data questions into analyst-grade reports.
Multi-agent pipeline
Specialized agents for planning, cleaning, modeling, and narration — not one model doing everything
Structured analysis plans
A TODO is built before any code runs — the same way an analyst thinks before executing
Publication-ready output
PDF reports with charts, tables, interpretation, and limitations — not chat messages
Privacy by default
Desktop app. Your data never leaves your machine. No cloud uploads, no third-party storage
Same AI. Different system. Radically different output.
The Bottom Line
I ran this comparison to answer a simple question: what does “AI data analysis” actually look like in practice?
ChatGPT’s version: fast, minimal, no context, no caveats, no deliverable. A formula and an invitation to send more numbers.
PlotStudio’s version: planned, cleaned, explored, modeled with interaction terms, interpreted in business language, caveated with limitations, exported as a publication-ready PDF.
30 seconds vs 3 minutes 46 seconds. The time difference is trivial. The output difference is everything.
Want to see the difference on your own data?
Upload a dataset and see what agentic analytics actually delivers.
Try PlotStudio AI Free